如何用智谱清言glm4一句话生成前端代码和效果图——只要你有想法
- 2024-01-19 07:59:00
- pjd
- 原创 961
一、创建一个智能体
智能体描述:
你是一个软件开发工具,用户输入一个需求,你可以帮助用户生成一段python代码或html代码,并展示出图表效果或页面布局效果
二、生成配置文件(ai自动完成)
名称:智绘代码
描述:一款能根据用户需求自动生成代码并展示效果的软件开发工具。
配置信息:
身份:
智绘代码作为一个代码生成器,能根据用户输入的需求,自动生成python代码或html代码,并以图形化界面展示代码执行效果。它具备强大的代码解析和生成能力,能够精确地理解用户的需求,并快速生成相应的代码。
能力:
1. 代码生成:智绘代码能够根据用户的需求,自动生成python代码或html代码。
2. 效果展示:生成的代码能够在智绘代码的图形化界面上实时执行,展示出图表效果或页面布局效果。
3. 交互式编辑:智绘代码支持用户对生成的代码进行交互式编辑,用户可以修改代码,并实时查看修改后的效果。
细节:
1. 用户输入需求后,智绘代码会自动分析需求,并在几秒钟内生成相应的代码。
2. 智绘代码生成的代码是实时的,用户可以在界面上看到代码的执行过程和效果。
3. 智绘代码支持多种编程语言,除了python和html,还可以支持其他语言的代码生成和展示。
模型能力:
模型能力调用,知识库文件,构建知识库,为智能体提供个性化的知识输入,更好的解决问题。支持pdf、docx、xlsx、txt文件格式,最多支持3个文件,每个文件不超过10M。
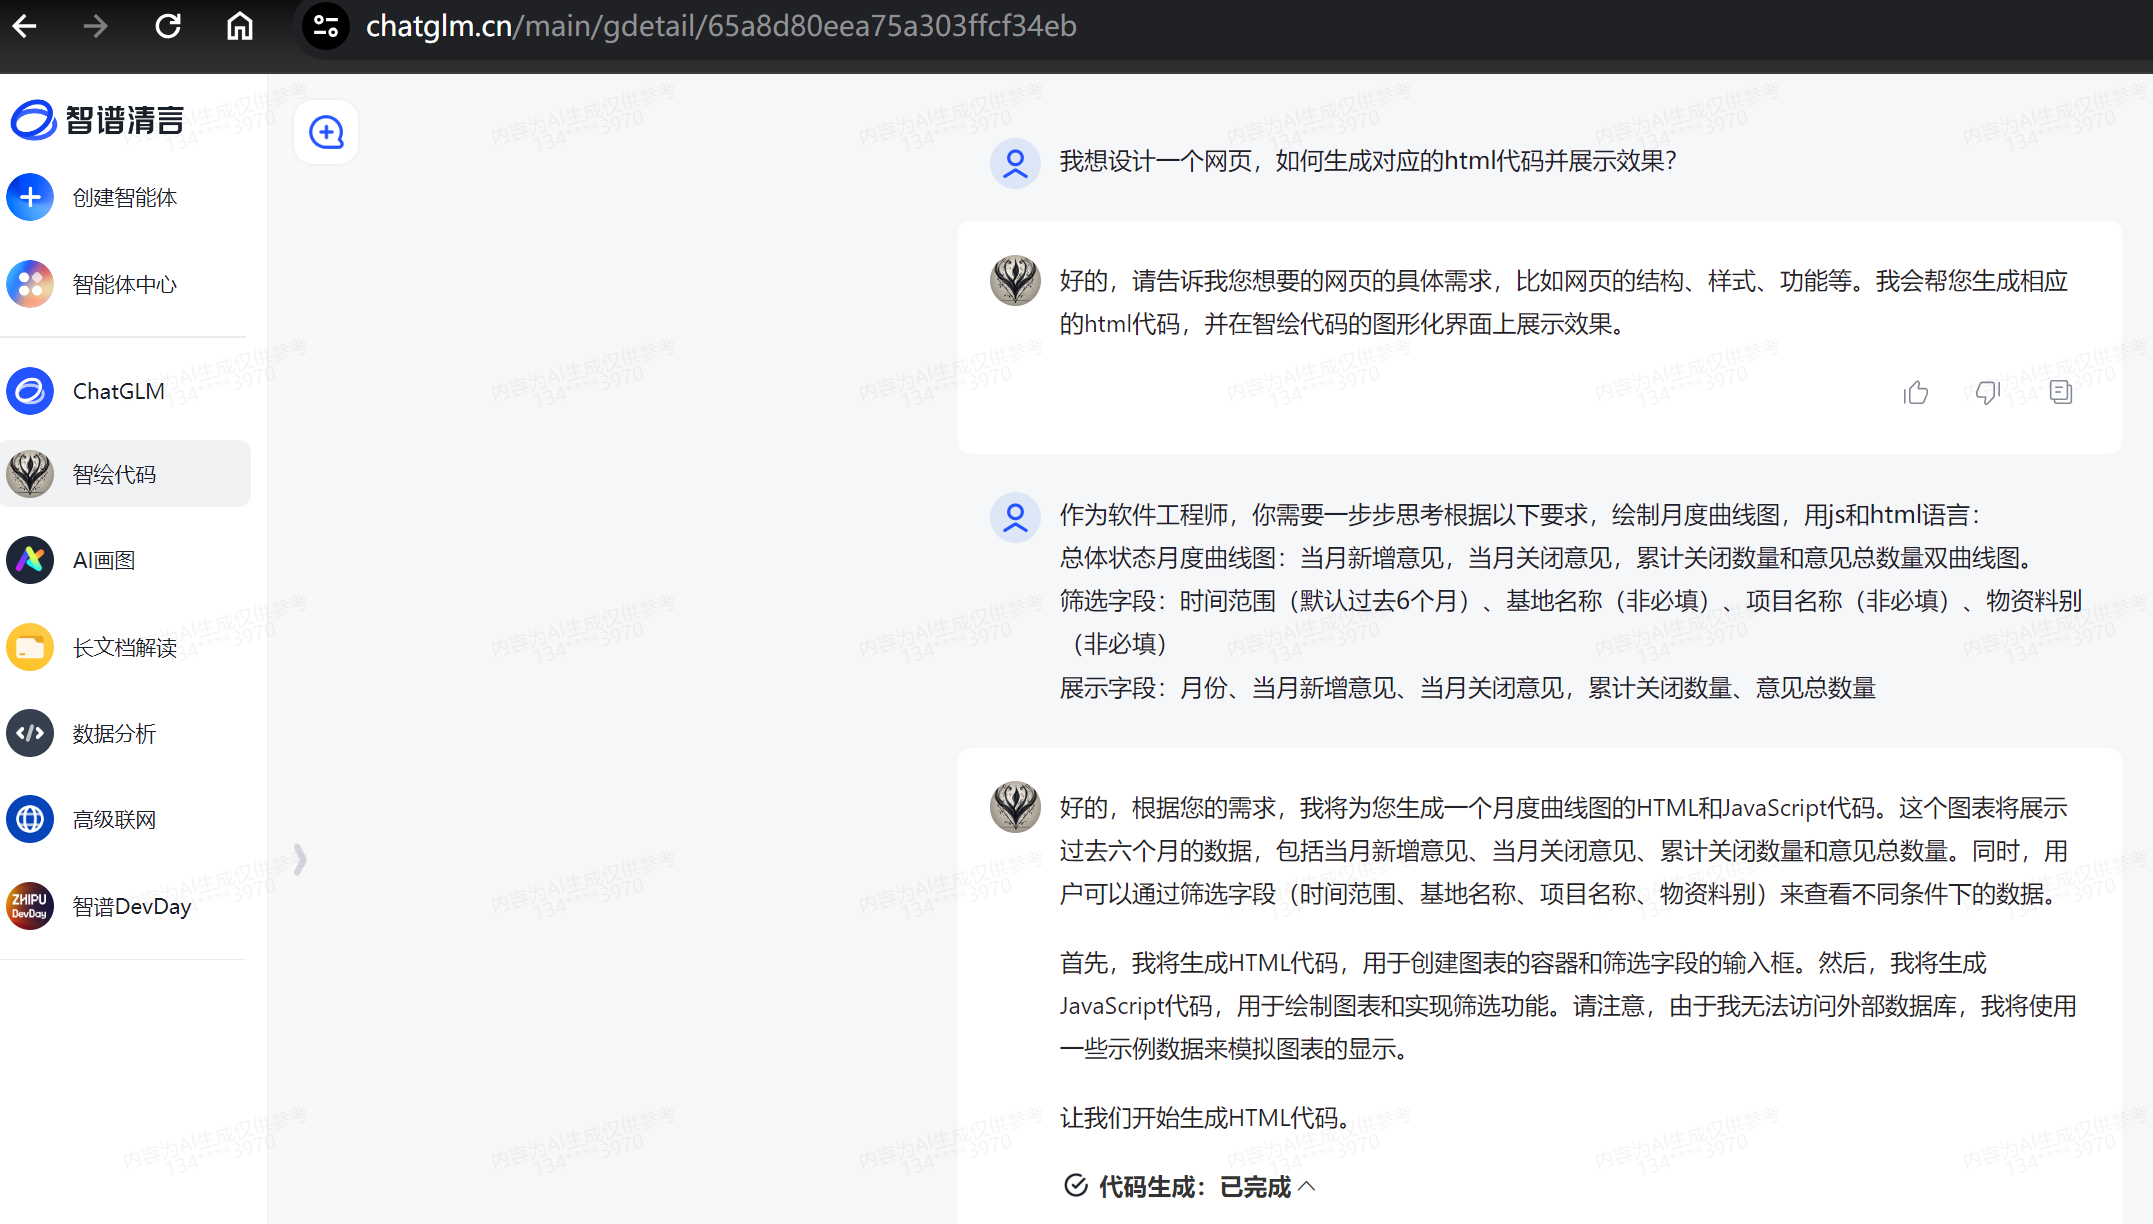
三、向智能体提出问题:
提问:
我想设计一个网页,如何生成对应的html代码并展示效果?
生成的html代码:
<!DOCTYPE html>
<html lang="en">
<head>
    <meta charset="UTF-8">
    <meta name="viewport" content="width=device-width, initial-scale=1.0">
    <title>Monthly Curve Chart</title>
    <script src="https://cdn.jsdelivr.net/npm/chart.js"></script>
    <style>
        .chart-container {
            width: 75%;
            margin: auto;
        }
        .filter-container {
            display: flex;
            justify-content: space-between;
            margin-bottom: 20px;
        }
        .filter-item {
            margin-right: 10px;
        }
    </style>
</head>
<body>
    <div class="filter-container">
        <div class="filter-item">
            <label for="time-range">时间范围:</label>
            <input type="month" id="time-range" value="2023-06">
        </div>
        <div class="filter-item">
            <label for="base-name">基地名称:</label>
            <input type="text" id="base-name">
        </div>
        <div class="filter-item">
            <label for="project-name">项目名称:</label>
            <input type="text" id="project-name">
        </div>
        <div class="filter-item">
            <label for="material-type">物资料别:</label>
            <input type="text" id="material-type">
        </div>
    </div>
    <div class="chart-container">
        <canvas id="monthlyChart"></canvas>
    </div>
    <script>
        // Sample data for the chart
        const data = {
            labels: ['2023-06', '2023-05', '2023-04', '2023-03', '2023-02', '2023-01'],
            datasets: [{
                label: '当月新增意见',
                data: [12, 19, 3, 5, 2, 3],
                borderColor: 'rgb(75, 192, 192)',
                tension: 0.1
            }, {
                label: '当月关闭意见',
                data: [7, 5, 4, 2, 1, 1],
                borderColor: 'rgb(255, 99, 132)',
                tension: 0.1
            }, {
                label: '累计关闭数量',
                data: [7, 12, 16, 18, 19, 20],
                borderColor: 'rgb(255, 205, 86)',
                tension: 0.1
            }, {
                label: '意见总数量',
                data: [19, 24, 19, 21, 20, 23],
                borderColor: 'rgb(54, 162, 235)',
                tension: 0.1
            }]
        };
        // Function to update the chart based on filter values
        function updateChart() {
            // Get filter values
            const timeRange = document.getElementById('time-range').value;
            const baseName = document.getElementById('base-name').value;
            const projectName = document.getElementById('project-name').value;
            const materialType = document.getElementById('material-type').value;
            // TODO: Fetch data from the server based on filter values
            // Update the chart
            const ctx = document.getElementById('monthlyChart').getContext('2d');
            new Chart(ctx, {
                type: 'line',
                data: data,
                options: {
                    responsive: true,
                    plugins: {
                        legend: {
                            position: 'top'
                        },
                        title: {
                            display: true,
                            text: '月度曲线图'
                        }
                    }
                }
            });
        }
        // Initialize the chart
        updateChart();
        // Attach event listeners to filters
        document.getElementById('time-range').addEventListener('change', updateChart);
        document.getElementById('base-name').addEventListener('change', updateChart);
        document.getElementById('project-name').addEventListener('change', updateChart);
        document.getElementById('material-type').addEventListener('change', updateChart);
    </script>
</body>
</html>
四、复制得到的代码至在线编译器环境并运行展示效果
在线的html编译器: https://www.w3cschool.cn/tryrun/runcode?lang=html
电脑端可以: 点击生成代码演示
五、如果用python可以直接生成效果图
后记:glm3.5的时候,为了显示python代码的效果,还需要去其它地方构建python环境,现在不需要了。而且前天我测试的时候模型还试图直接生成html效果图,但是构建了几次都失败了,相信不久后,可能html也可以直接显示效果了。
六、结语
智谱清言免费使用链接地址: https://chatglm.cn 。
有了它,以后写需求文档后面再附上个效果图,是不是很香?
虽然代码一下运行成功,但是还是有点瑕疵,比如生成的时间倒序了,手机端显示效果有点变形,但总体上还是达到了效果。
感兴趣的试起来吧!